Crime Analysis

The Police Department of Chicago reported more than 7 millions crime since 2001. Those crimes fall
into multiples categories (eg homicide, prositution...).
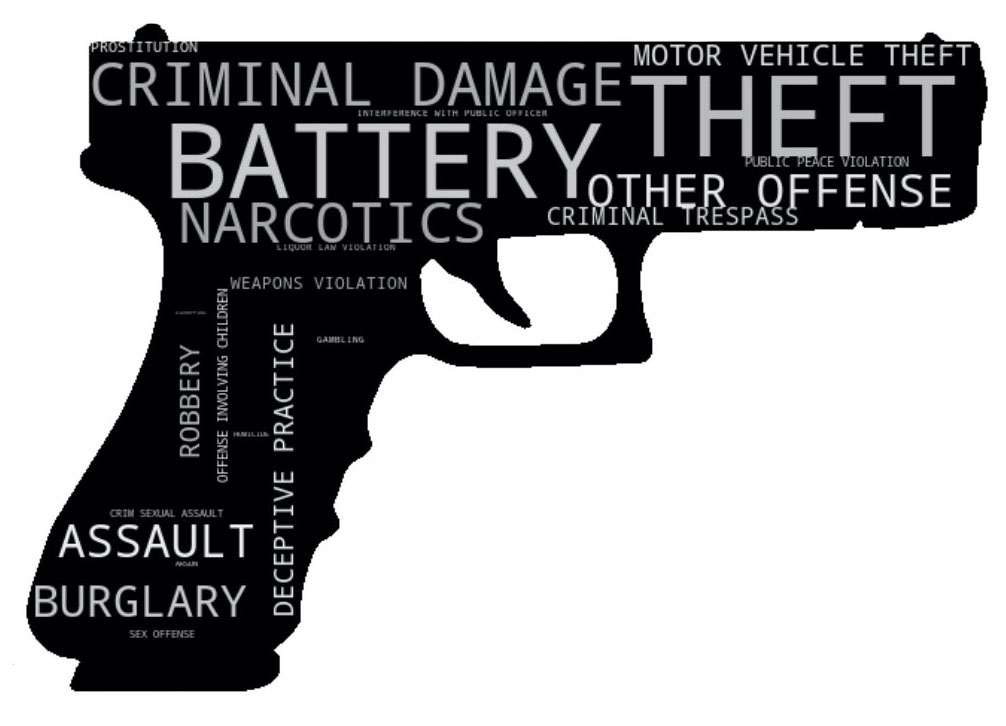
The bigger the text, the more frequent this type of crime is in Chicago.
We can see what are the most frequent kind of crime.
Here is an explanation of some of them that might not be familiar for everyone:
- Battery: "A person may be charged with the crime of battery under Illinois law if he or she makes actual physical contact with another individual with the intent to injure, provoke, or insult that person."
- Criminal Damage: "You can be charged with criminal property damage if you: damage someone else's property knowingly, damage someone else's property recklessly by fire or explosion, knowingly set fire to someone else's land, knowingly injure someone else's pet, cause damage to property in order to collect insurance."
- Criminal Trespass: "Trespassing on a residence, real property, or some else's vehicle is a crime in this state. You can be charged with criminal trespass if you enter a building illegally, go on someone's land after notice has been given to stay away, or stay on a property after you have been asked to leave"
- Deceptive Practice: "If a person makes a false statement to promote the sale of property or services, pays for something with a check that the purchaser knows will not go through, makes a false statement to obtain a bank account, or possesses stolen checks, among many others infractions, that person may find himself facing charges of deceptive practices."
More information can be found in the sources. [1] [2].
In order to reduce violence, Chicago Police Department adopted new crime-fighting techniques in 2004 thanks to cooperation with the LAPD (Los Angeles) and NYPD (New York City). Let's see how crime has evolved since the Police started to collect crime data in 2001.
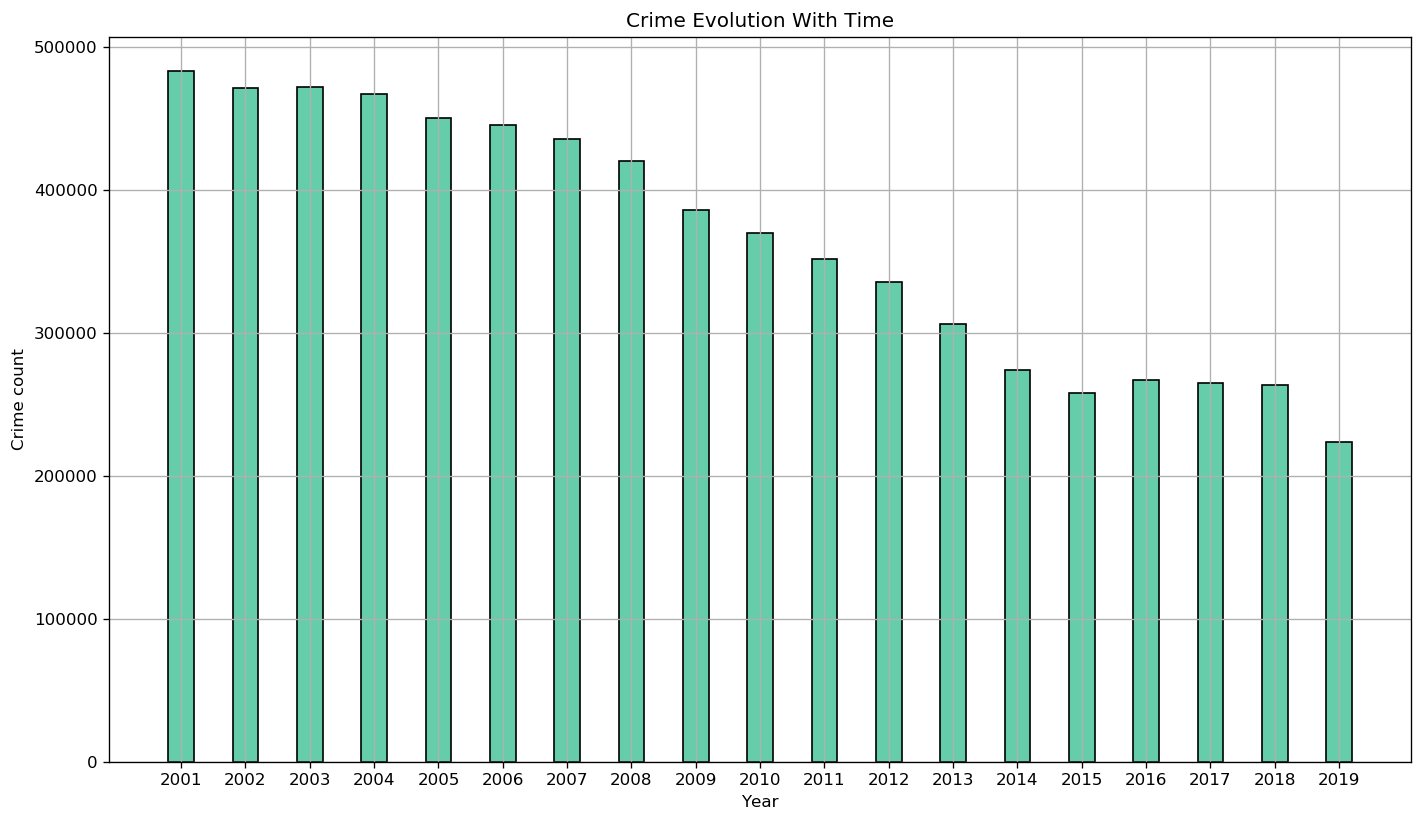
Indeed, crime started decreasing after 2004. However did the new techniques employed by the Police lead to more arrests?
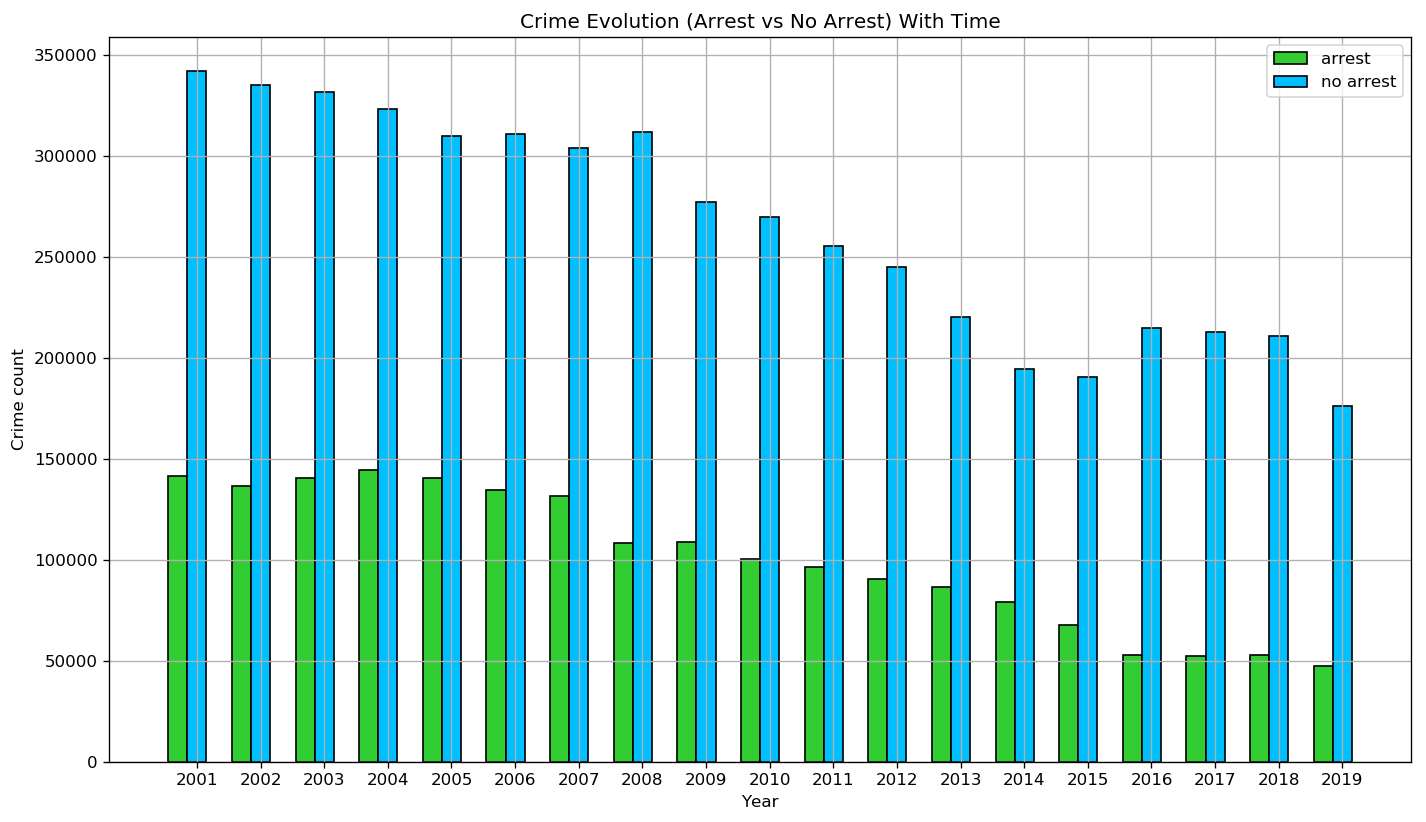
Even though Police adopted new techniques in 2004, we see that the proportion of arrests did not increase. An hypothesis is that the new techniques are mostly for preventing crime. They reduced the number of crime rather than the number of cases closed with a criminal arrested.
Sometimes looking at the whole data at once is not representative of sub-categories. In order to see if
HOMICIDE crimes have followed the same trend we will now show the homicide evolution.
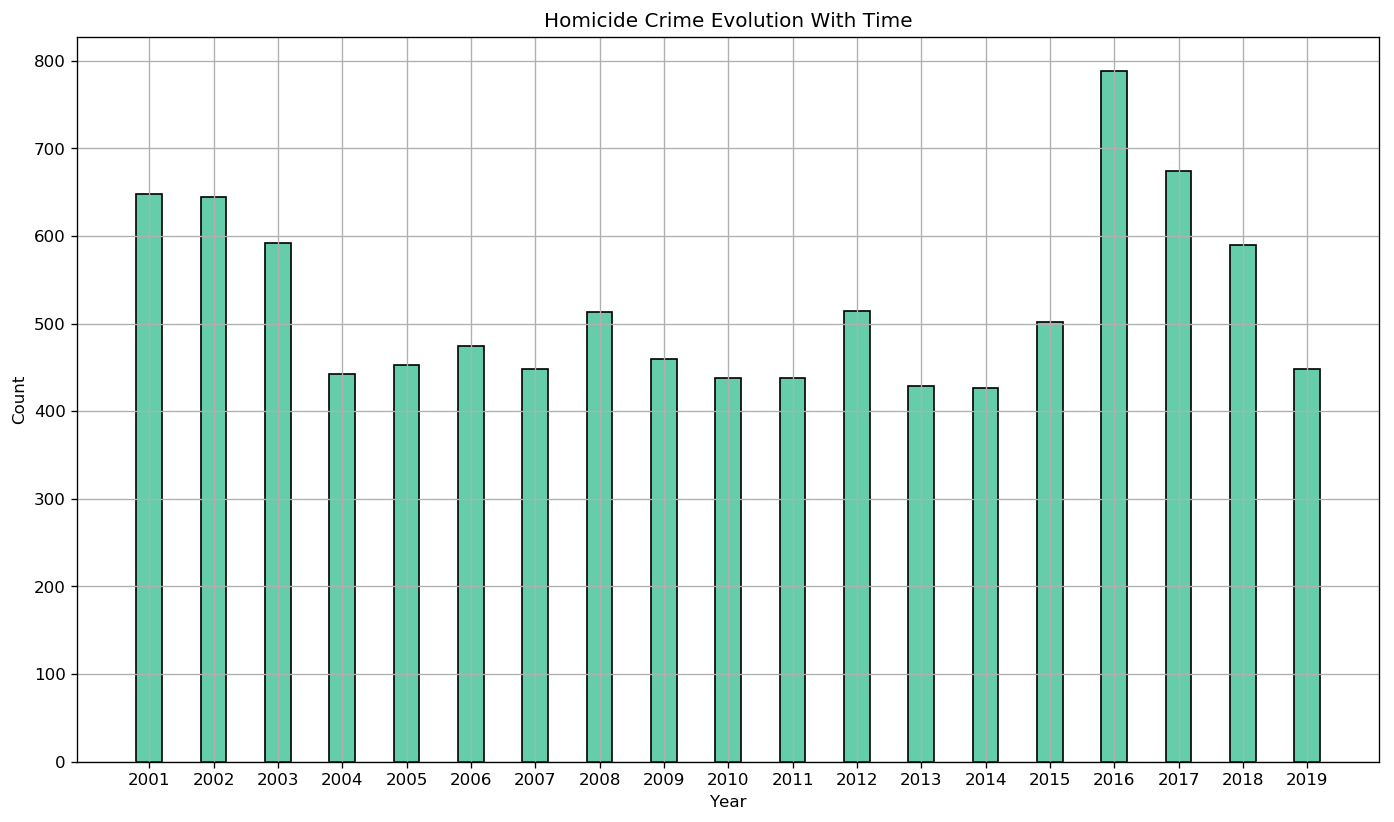
It is very interesting because we can see a huge drop in 2004 that might be correlated with the new crime-fighting techniques used by the Chicago Police. However the trend is now different than when we consider all kinds of crime together. Indeed we can clearly see the rise of homicides in 2016. This sudden rise of homicides was widely cover in the newspapers in the U.S.A. This huge homicide rise in Chicago was apparently responsible for half of the cases that led to a rise of homicide in the USA for 2016.
Let's now try to have a spatial analysis of crime in Chicago. It is interesting to relate specific areas to other factors such as the number of crimes, type of crimes to better understand where violence is happening. We will split the city into community areas. There are 77 community areas in Chicago. Our first approach is to consider crime in the North vs in the South of Chicago.
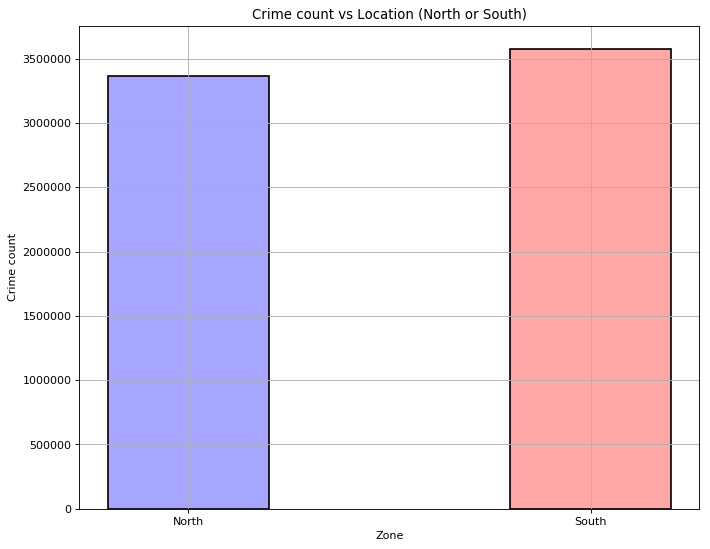
We cannot tell if the South is more violent than the North or vice versa. We need to split the city in smaller areas to obtain better insights. The following map displays the number of crime reported per community area and hoovering on an area will tell you what are the top 3 most frequent crimes for that area.
We can deliver interesting insights from this map:
- Indeed as we can see the most violent zone in term of the number of crime has NARCOTICS as its first crime type. Areas where there is drug dealing are usually linked with violence. Overall, the zones with NARCOTICS being one of the top 3 crime are zones with a bigger number of crimes than others.
- What is also interesting is Chicago Downtown. We can find DECEPTIVE PRACTICE as one of the top crime. It is in the downtown area that you will find most of the business activities of Chicago. Thus there might be a relation between a high number of businesses and the number of deceptive practices that if don't remember are usually linked to fraud.
- In the 'Airport area' we can see OTHER OFFENSE. It might have a link with the presence of the airport. Indeed, airports usually come with special legislation.
- One interesting fact is that areas at the edge of Chicago usually have THEFT as a first type of crime. We can thus speculate that those areas are usually residential ones.
Let's have a look at what kind of crime those OTHER OFFENSE, in the airport area, correspond.
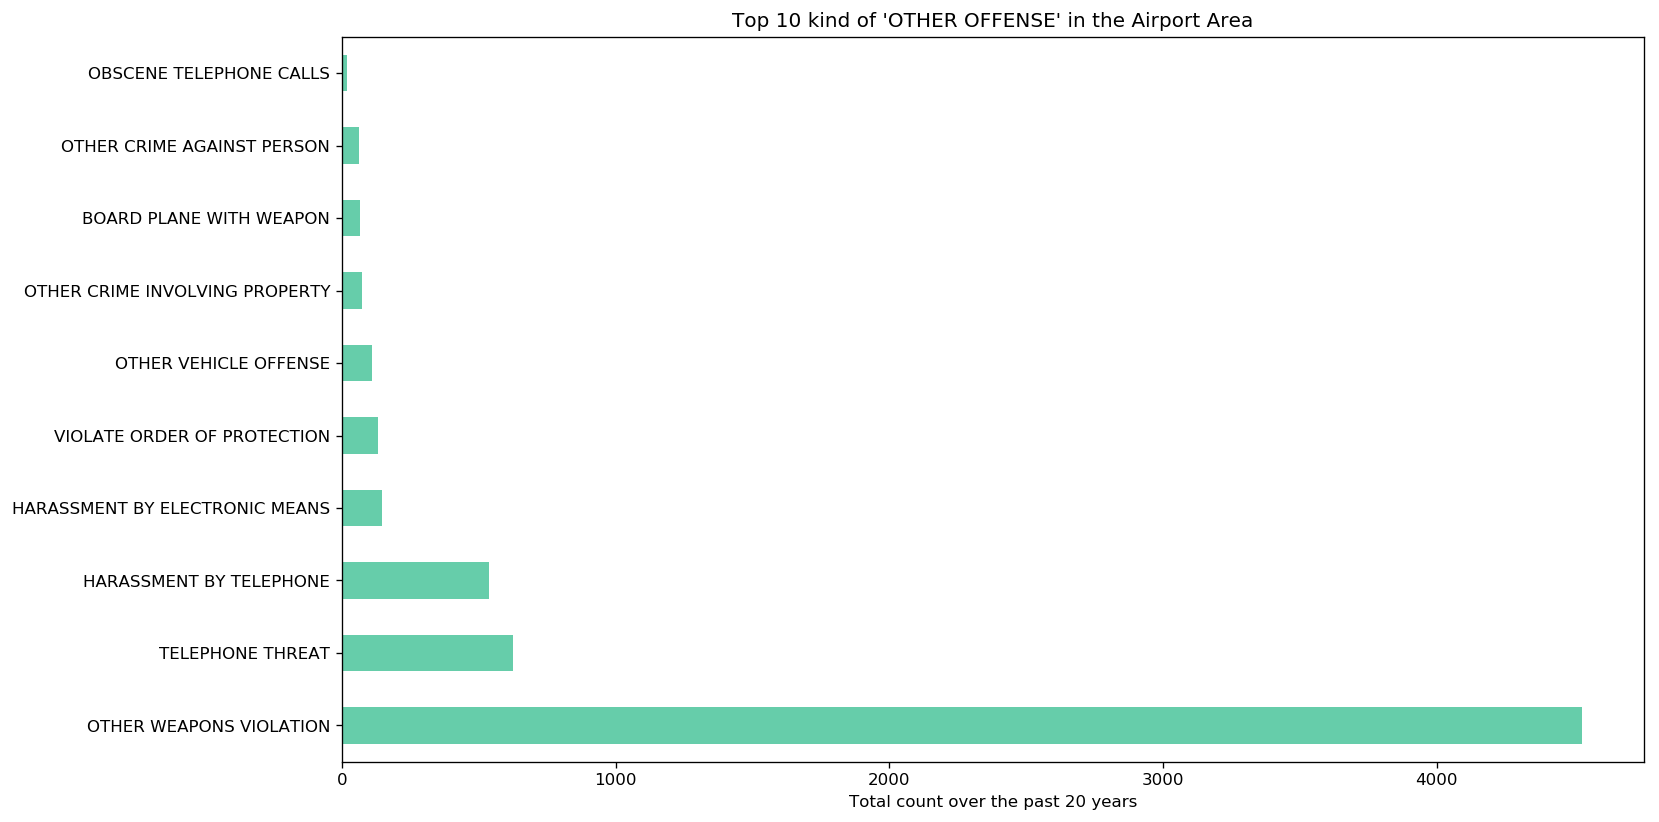
You can observe that the most important one is OTHER WEAPONS VIOLATION. It seems that, as it is strictly
forbidden to have a gun in an airport in Illinois, this might lead to a lot of such cases. Indeed,
there are generally no restrictions for other areas. [3]
We should compare the crime map with the homicide one as we realized earlier than homicide crime were following
another trend than crime in general. You can see below a heatmap of the homicides in Chicago since 2001.
This map confirms our previous analysis. As we can see the areas with a high density of homicides are
usually in community areas with narcotics as one of the top crime. It suggests that violence in
Chicago is related to drug dealing and more generally to criminal gang activity.
Moreover, areas without a lot of homicide cases are usually in the border of the city. Those
neighborhoods are probably residential.
We can also think that some central areas without a high number of crimes are well protected. Indeed,
there is not a lot of homicide cases near the Downtown or the University. Those important areas are
usually well protected. As an example, it is interesting to know that the University of Chicago has
its own Police Department.
We will now see if there is a relationship between violence and demographic evolution.
We thus took into consideration the population of each community area to obtain a crime rate per 100,000 inhabitants.
The following map shows the crime rate per community area in 2002, 2010 and 2017. Adding the layer sequentially (using the button on the right)
can help you understand how violence evolved over the past 20 years. The first layer shown is the crime rate for 2002.
What can be seen is that the Downtown was the most violent zone
in 2002 in term of crime rate. We have to remember that people usually do not live in the Downtown
as this area is dedicated to businesses so the crime rate might be high for this reason.
However, we can see that the crime rate for the downtown area
decreased a lot between 2002 and 2010. It might correspond to a huge effort made by the Police to
fight violent in the busiest area of the town.
We can, by adding layers successively that violence is spreading in the West of Chicago with
community areas Austin, Humboldt Park, West Garfield Park, East Garfield Park and North
Lawndale and in the South of Chicago with community areas Fuller Park, Englewood and West
Englewood for example.
Now let's see how the population of each area evolved between 2000 and 2010, and between 2010 and 2017. We might see
trends such as people leaving violent areas, or joining new areas. The button on the right can be used to change between 2000-2010
and 2010-2017.
As we can see the most violent area Austin had a huge population drop between 2000 and 2010. In
general, areas that were associated with violence in our analysis correspond to areas with a
population drop.
Moreover, we can clearly see that the downtown area gained population between 2000 and 2010. As we
realized, the crime rate dropped in that area between 2002 and 2010 even though there were more and
more people living there. It really means that the Chicago Police tried to reduce violence in the
downtown area.
However, from 2010 to 2017, we can see that lots of areas are concerned with the population's decrease.
Especially the violent ones and the ones in the border of Chicago. Finally, it seems that areas
around downtown are still attracting people.